SKETCHBOOK
SKETCHBOOK
SKETCHBOOK


UX PROJECTS
VISUAL DESIGN
MediaScience Internship
UX Designer & Visual Designer | January 2021 - January 2022
Projects
-
Analyze case studies in neuromarketing research for partnerships with corporations including Google, Hulu, Comcast, and more. Translate 50+ text case study reports into distributable one-pagers and infographics for research clients.
-
Develop wireframes and ideate on mobile/pc dashboards and website assets for research proposals for potential clients.
-
Design/ redesign business cards, icons, infographics, and pitch decks to represent the brand's vision of transparency and efficiency.
These projects have been critically integrated into the MediaScience Website
Role
-
Primary In-House Designer
-
Present work at weekly meetings with the SVP, appreciating feedback for my designs from a business development perspective
-
Direct communication with CEO, receiving time-sensitive projects
Tools
Skills

UX Project 1: Case Studies Gallery
8 Month Project | Clients: ESPN, Comcast, Google, Hulu, TikTok

Problem Space
How can I increase engagement for the MediaScience brand and encourage potential research clients to explore the website?
Analyzing the current website design for redesign and improvement, I noticed that MediaScience has impressive research studies with large corporations including Google and TikTok, yet new viewers and potential clients hardly read the reports since they're 2-3 pages of text abruptly placed on the website.
Solution
I initiated the concept of converting these long-winded case reports into distributable and easy-to-understand one-pagers to display on their website. I then prototyped a new website dashboard concept to create an interactive case study gallery in Figma and am working on implementing it with HTML/CSS.
Project Overview
8 Month Project
Translated 50+ case studies with 8+ iterations of each study including horizontal and vertical explorations;
Created robust wireframes to categorize important information (working on information architecture);
Developed mockups and prototypes of the case study gallery dashboard; Drew iconography for the reports
Website Integration
Every case study is downloadable on the MediaScience website and emailed to potential research clients
Final Gallery Prototype
Interactive Figma Dashboard Prototype
Case study gallery prototype where new viewers to the website can browse past research quickly and efficiently; Each case study refers to a 1 page graphic summarizing the research study.


Developing Individual Case Studies
Converting 50+ 2-3 page text research reports for various clients into easily understandable 1-page graphics on Figma with self-drawn iconography


Hulu Case Study
Experimented with a variety of concepts and iconography aligning with the MediaScience branding (i.e. mind map concept: bottom right)
Created vertical (page format) iterations as well as horizontal iterations for multiple use cases such as distributed via email, displayed on websites, and included in proposal pitch decks
Wireframed information placement and created different categories of text for viewers to easily understand sections
Wireframes

Horizontal Iterations
.png)
6 Vertical Iterations

Mars Case Study
Meeting with the SVP twice a week to discuss iterations, we settled on a horizontal case study format for convenient distribution and integration into pitch decks. We also decided on boxes to easily emphasize different sections and extract components of different studies if needed in the future.
Wireframe

8 Vertical Iterations


Final Horizontal Iterations
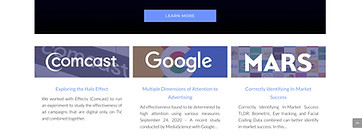
Effectv (Comcast) & Google Case Studies
Experimented with dark and light themes as well as branding according to client company (drew gradient icons for some of the iterations). Click to open PDF


.png)
TikTok Case Studies
Series of 2 studies. Condensed and categorized information into a set of uniform boxes and incorporated TikTok and MediaScience branding. Also explored several full one-page iterations without separations


Other Case Studies
Other Clients: Think Premium Digital, ESPN, ABC, Jared, Good Morning America (several others not featured for confidentiality reasons)


Impact
The case study graphics I created for MediaScience's research have been critically integrated into their website. Viewers must sign up for their mailing list to download a pdf version of the study. This translation of research showed improved engagement with the case studies on their website and increased the number of people that subscribed to their email list, improving MediaScience's viewership and brand credibility. Prototypes for the gallery are in the process of being implemented.
New MediaScience Website

To emphasize their high profile clientele, the home screen was changed to include a grid of clients, where clicking on a name would navigate to that particular study.

Under the page for each study, my one page graphic can be downloaded after a viewer subscribes.
Reflection
While developing these studies, I grasped the importance of condensing information, only translating the main points of every study and information architecture: how displaying information in categories with iconography makes it substantially easier for new viewers to understand content. I also learned how to maintain the MediaScience brand while also incorporating elements of their research clients.
Simultaneously, working closely with the SVP during weekly meetings allowed me to deep dive into the actual research for each study and learn advertising and research concepts such as the halo effect, limited ad exposure effects on brand recall and recognition, and the impact of premium ad content.
Working in cross-functional teams as the only in-house designer, with the CEO and the brand development team taught me to appreciate the input of non-designers on my work from a business/ marketing and front-end engineering standpoint.
UX Project 2: NBA Dashboard
1-2 Week Project | External Clients: NBA


Project Overview
As a proposal to a new research client, I redesigned a mobile dashboard concept, creating dark and light-themed iterations to portray a more modern dynamic style. I also redesigned visual elements for easier use such as creating intuitive components including sidebars, buttons, and dropdown menus to represent filters instead of pillboxes.
Project Impact
After pitching my proposal prototype, Mediascience acquired a new major research client.
Original Design
Before requesting I redesign the dashboard experience, the CEO created the original design below using Keynote.

Remaking Dashboard Components
I began with remaking components including a side panel with minimizeable capabilities, search features, and a card format.

Final Redesign & Interactive Prototype
(Company content censored for confidentiality purposes)

%201.png)

Project 3: Process & Product Infographics
3 Week Project
Project Overview
Since the MediaScience Research process can be confusing at first sight, after interviewing and conducting several meetings with MediaScience leadership, I developed a detailed 2-page infographic that breaks down the process into 6 main steps.
Design Requirements: Purple heavy focus and large use of iconography
Impact
Working with the brand integration and development team, this process is displayed on the MediaScience website using HTML/ CSS and the flyer/ pitch deck formats are sent to potential research clients.


Project Overview
Realizing the wide variety and complexity of products that MediaScience offers, I created a one-page graphic for each research platform. These are included in client emails and pitch decks.


Website Integration & Impact


Project 4: MediaScience Referral Cards
1-2 Week Project
Project Overview
Developed a series of iterations redesigning the original referral cards to align with MediaScience branding colors and design elements.
Impact
The cards are currently produced and used in the Austin, Chicago, and NYC Labs.
Original Design

Final Redesign

Mockups

Iteration Process

Project 5: MediaScience Firsts Interactive Timeline
2 Week Project
Project Overview
In the past 14 years, MediaScience has been a leader in experiments broadening market research knowledge. Consolidating all of MediaScience's most impressive accomplishments, I created one comprehensive scrollable and hoverable timeline. (Coded on MediaScience website). Each of the icons are illustrated on Figma.

Impact
To increase viewership to the MediaScience website and their impressive accomplishments, this timeline is integrated into the MediaScience Website Main Page: https://www.mediascience.com/ms-firsts/
Project 6: MediaScience Firsts Modules
1 Month Project
Project Overview
Each company accomplishment is a new module in this large repository with a brief overview alongside customized icons/ images. I have rearranged the modules to create one-pagers, presentations, and timelines for the website. I created dark and light versions, the dark ones being used for daily LinkedIn posts for 1 month by the CEO and SVP as a new campaigning concept.
.png)
%20(1).png)
Website Integration


Continuously create icons for reports, infographics, and the website, developing a repository for future use with Adobe Illustrator & Figma.
Iconography


